|
A Leading South African Test and Measurement Instruments Supplier |
|
“For Good Measure”® |
|
T.M.I. |
|
Test and Measurement Instruments C.C. |
|
Please contact us by phone, email or visit us at the details given above. We look forward to hearing from you. |
|
All brands, trade names, trade marks, and logos are the property of their respective owners. |
|
Brand Names |
|
CK 1985/007464/23 |
|
“Tomorrow’s Instruments Today” — “For Good Measure” ® |
|
TMI, Established—1982 |
|
English, Afrikaans, Portuguese Speaking. Master/Visa Credit Cards |
Colours in Thermography, Thermal Imaging. |
Thermal Colours |
|
A brief History of Thermography and Medicine. |

|
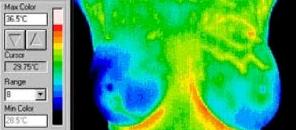
What is the meaning of the Colours? A number of factors must be considered when viewing a thermal image; i.e. the colour is a map of the temperature base and the temperature range. It is most important to understand what the colours themselves mean, so let’s describe them: Colours - It’s important to understand that particular colours are not assigned to a particular temperature in all thermal images. Colours are simply a visual aid to understanding the temperature gradients involved in each image. Colours are assigned arbitrarily according to the particular colour map used for an image (see below). It would be incorrect to assume that particulars colours may be warmer or cooler. The Colour Bar is shown on the screen with available colours in relation to the range. The portion called Cursor showing a temperature is used only in the imaging program and is not relevant to this discussion. The Colour Map - From the simple concept of a greyscale image versus a colour image, an understanding of colour maps can be gained. Essentially, colour maps define the number of colours that will be attributed to a temperature band in particular images. Below are three breast images of a woman who has a number of cysts in the left upper breast, with the left image in the standard 16 colour "colour map", the middle in greyscale "colour map", and the right image in red/green/blue "colour map". |









|
1. The colour map determines how many colours and what colours are assigned to specific temperature ranges. 2. The temperature base is the top and bottom temperature to which a colour is assigned by the colour map. 3. The temperature range determines what spread of temperatures will be examined in a particular image. 4. All images, unless labelled otherwise, should be saved in sixteen colours representing a range of eight degrees. 5. All contra-lateral (other side) images should be saved in identical colour map, base and range. |
|
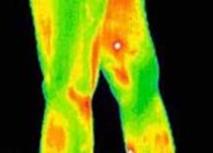
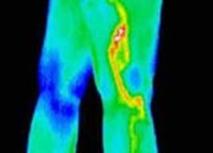
An Association has set a range of 8 degrees and a colour map of 16 colours as the default settings that its members will commonly save an image in. Should there be the need to deviate from this standard, a second image will be saved with the new settings. In South Africa this may very not be the case. It would mean that in every study, there should be a standard format image and an additional special formated image as well. There should never be a case where there is no standard format image, but these are still early days. If one body part, let’s say an outside thigh, is imaged, it should be saved using the same settings as its contra-lateral (other side) partner. Doing the scans in this way, when you look at a left and right outside thigh, you should know that the colours mean the very same for both images. The images below illustrate this principle, as well as the one described in the previous paragraph. The left image is the outside right thigh and knee, the centre is the outside left thigh and knee, with both images being captured in the same temperature base and range in the standard colour map. As you can see, there is a large hot line on the outside thigh in the centre image, with most of the details of the actual phenomena beyond the top end of the temperature base (white). The right image is a modified version of the centre picture showing greater detail of the inflamed varicose vein that was causing the symptoms. This is also a good example of contra-lateral comparison. |
|
We have now seen what happens when changes are made to the Temperature Base, so lets examine changes to the Temperature Range. The temperature range are the colours that are allocated to the temperature band. These principles hold true for all colour maps. We now understand the standard 16 coulurs have been assigned to a temperature range over 8 degrees in half degree increments. By changing the temperature range , so will the range of each colour change in a representative manner. In this image below, the temperature range has been narrowed too a 4°C window, in place of the 8°C above. The same colours are still being represented, but now with a 0.25 (1/4) spread per colour. Now we can see that by narrowing the range we can increase the definition of a portion of the image, but loses much of the information over the rest of the image. A narrowed temperature range will be used as an additional image (to the standard) to improve the definition of a particular phenomena. |
|
So if the represented temperature base is raised by 1.5°C to represent an 8° temperature range from 28.5°C - 36.5°C, one can see that we have lost some detail from the “bottom" of the represented temperatures. It is then correct to state that it is crucial to select the correct temperature base for the images to be useful for clinical and medical use. |
|
To comprehend the principle of temperature base adjustment, let us see what happens to the same images if we keep the 8° temperature range, but lower the temperature base 1.5 degrees to represent a temperature base of 25.5°C to 33.5°C deg from 27-35. We can now see that we have lost a lot of definition out of the “top'“of our colour scale. Now we can see that the temperatures of the screen lie within a specific range, and the base selected for the displaying of those temperatures is now not appropriate, and does not represent the subject fully. |
|
This temperature base displays a 8°C spread (range) between 27°C and 35°C. The displayed colours all relate to specific temperature bands. When we look at the this image in a Standard 16 "colour map", there are sixteen colours available and are assigned in the image from white to black. All colours in this colour map are assigned a half degree temperature band individually. In this picture dark red may be assigned to any temperature between 34.5°C and 35°C and is also the standard default colour map used in all Thermal Imagers at this point. |

|
We would be very pleased to see you at our offices and show room at the address given above. Please use the maps supplied on our Contact Us page, or call us for directions, should you not be using our GPS Co-Ordinates supplied. It will be our pleasure to assist with your unique requirements. We trust that your visit will be an enjoyable one. T+M® For Good Measure. |
|
Every effort has been taken to ensure that all the information on these pages is accurate, however, no health care advice, suggestion or inference should be acted upon until you have consulted with your own doctor who can advise you with regard to the many factors making up your individual health picture. No website should act as a healthcare provider in any capacity. The purpose of any website is to stimulate ideas and generally inform the users and not to act as an absolute source of knowledge. |
|
Standard 16 Colour “colour Map” |
|
Grey Scale “Colour map” |
|
Red-Green-Blue “Colour Map” |
|
Copyright © 2009—2022 Test and Measurement Instruments C.C. | All rights reserved Colours in Thermography or Thermal Imaging in Medicine |
|
T + M ® |


|
T + M ® |


|
Brand Names |
|
All brands, trade names, trade marks, and logos are the property of their respective owners. |
|
Ph: +27 (011) 683 4365 / 6 E-mail: sales@instrumentsgroup.co.za
Physical Address: 3 Angelica Ave, Glenvista, Johannesburg, 2091 SOUTH AFRICA
Postal Address: P.O. Box 1416, Southdale, Johannesburg, 2135, SOUTH AFRICA |